
How do you know if your stores are fully exploiting their sales potential? Which underperforming stores would it be better to dispose of and which ones can be saved with the right measures?
The following steps explain how to correctly benchmark your stores. This allows you to respond to opportunities and threats in the best way and get the maximum return from your store network.
Step 1: Collect the right information about location and area characteristics
Many sales managers tend to focus solely on stores with low sales. But appearances can be deceptive because sometimes it simply cannot get any better. You should also realise that a profitable store is not necessarily a high-performing store! Only once you know what sales figures a store with specific characteristics at a particular location should be able to achieve, you can make these kinds of statements. Your stores cannot be compared on a one-to-one basis unless you do this based on the right data!
“A profitable store is not necessarily a well-performing store.”
How do you do this in a smart way? First of all, you divide your stores into several homogeneous clusters to be sure that you are not comparing apples and oranges. This will require some preliminary research.
So, you should look at the available market space (the “area's DNA”): the total market potential in the area around each of your stores in relation to the competitive pressure and the presence of any other stores of your chain (internal cannibalisation).
“Divide your stores into homogeneous clusters to avoid comparing apples and oranges.”
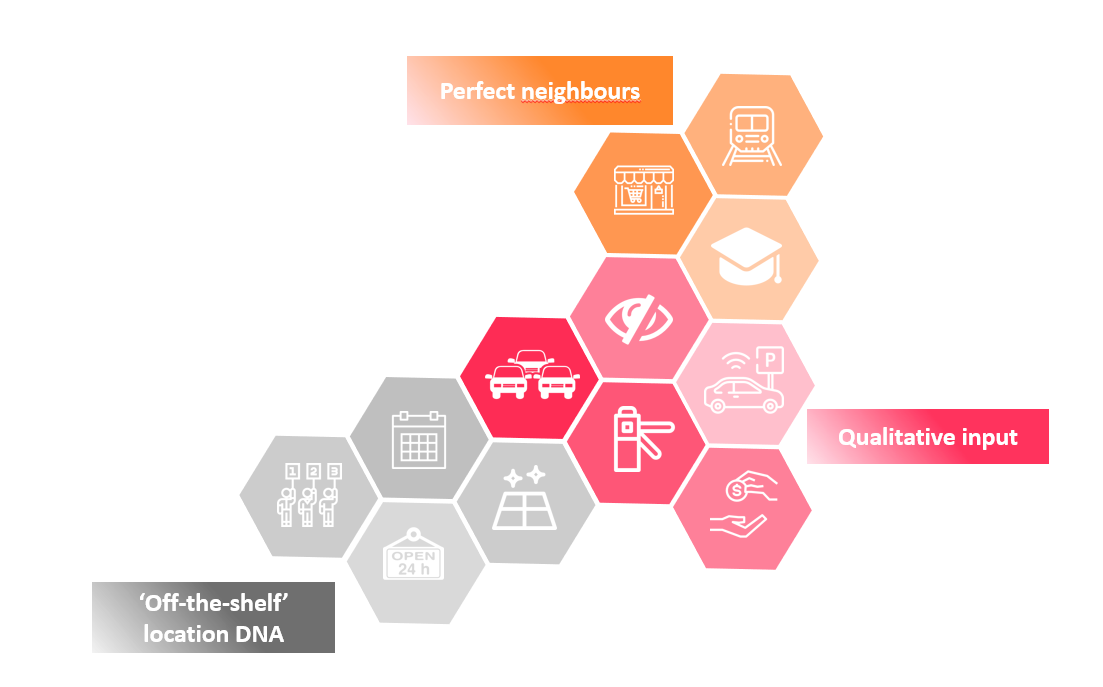
Other essential aspects are location characteristics (360° location DNA). These include the various characteristics of your stores’ locations, such as accessibility, parking pressure, visibility, footfall, opening hours, shop floor area, and the degree of urbanisation of the store’s local area. Location activity also play a major role because a store with the right neighbours can generate up to three times (!) more sales than a store with no neighbours or bad neighbours.
Once you have determined the market space and quality score of each store, you have everything you need to benchmark your stores’ current performance.
“Smart geomarketing algorithms will help you to discover how much revenue each store should be able to generate.”
Step 2: Identify underperformers and overperformers
With accurate geomarketing models, it is possible to calculate a location’s theoretical potential.
You can also divide your shops into “homogeneous clusters” based on the DNA of the area and location. A cluster consists of a group of stores with an almost identical market space and location DNA. In theory, all these stores should be performing at the same level. Of course, this clustering exercise should be done in close consultation with your organisation’s sales expert, who can use their knowledge of the stores to properly assess whether the stores in a cluster are really comparable. If this is not the case, refine the location DNA.
“You can learn a great deal from high performers. They possess all the success factors for your stores.”
When you have clustered your stores, you can look at the current performance of the stores for each cluster. The best-performing stores within a cluster can be categorised as “high performers” and the worst-performing as “low performers”.
High performers are particularly interesting because the other stores can learn from their success factors. They have apparently found the success formula to perform at their maximum within the type of environment of their cluster. Underperformers, on the other hand, should, in theory, be able to perform better.
Such benchmarking exercises can yield surprising results. For example, some stores that seem to be doing very well turn out to be only performing ‘as expected.’ In contrast, other stores with low sales figures turn out to be performing at the maximum level according to the benchmark.
Step 3: Take targeted actions
Once you have the overperformers, regular performers, and the underperformers broken down into categories, you can look for the underlying causes. You can then take targeted actions to optimise your current store network.
“If the area has a low potential, relocating or closing down may be the only solution.”
Stores showing low gross margins based on their KPIs need immediate attention in the form of action plans. For any stores showing average performance, real estate-based actions may be the only option, such as relocation, closure, or renovation of the store.
For the category ‘underperformers’, there are various types of in-store and marketing-related actions:
-
If the penetration rate is too low, you could focus on an activation campaign to raise awareness of your store.
-
If the visiting frequency is too low, you could invest in a loyalty programme. Reward customers for the frequency with which they visit the store.
-
If the average sales amounts are too low, take a look a what in-store improvements you can make. How about redesigning the store or changing the product range?
There is no immediate need for action plans for the underperformers with higher returns. Still, you can also pursue the potential for improvement for those stores as well.
“Penetration rates, visit frequencies, and average sales amounts are strongly influenced by geography.”
If you want to know precisely which sales KPI’s are too low, remember that penetration rates, visit frequencies, and average sales amounts are strongly influenced by geography.
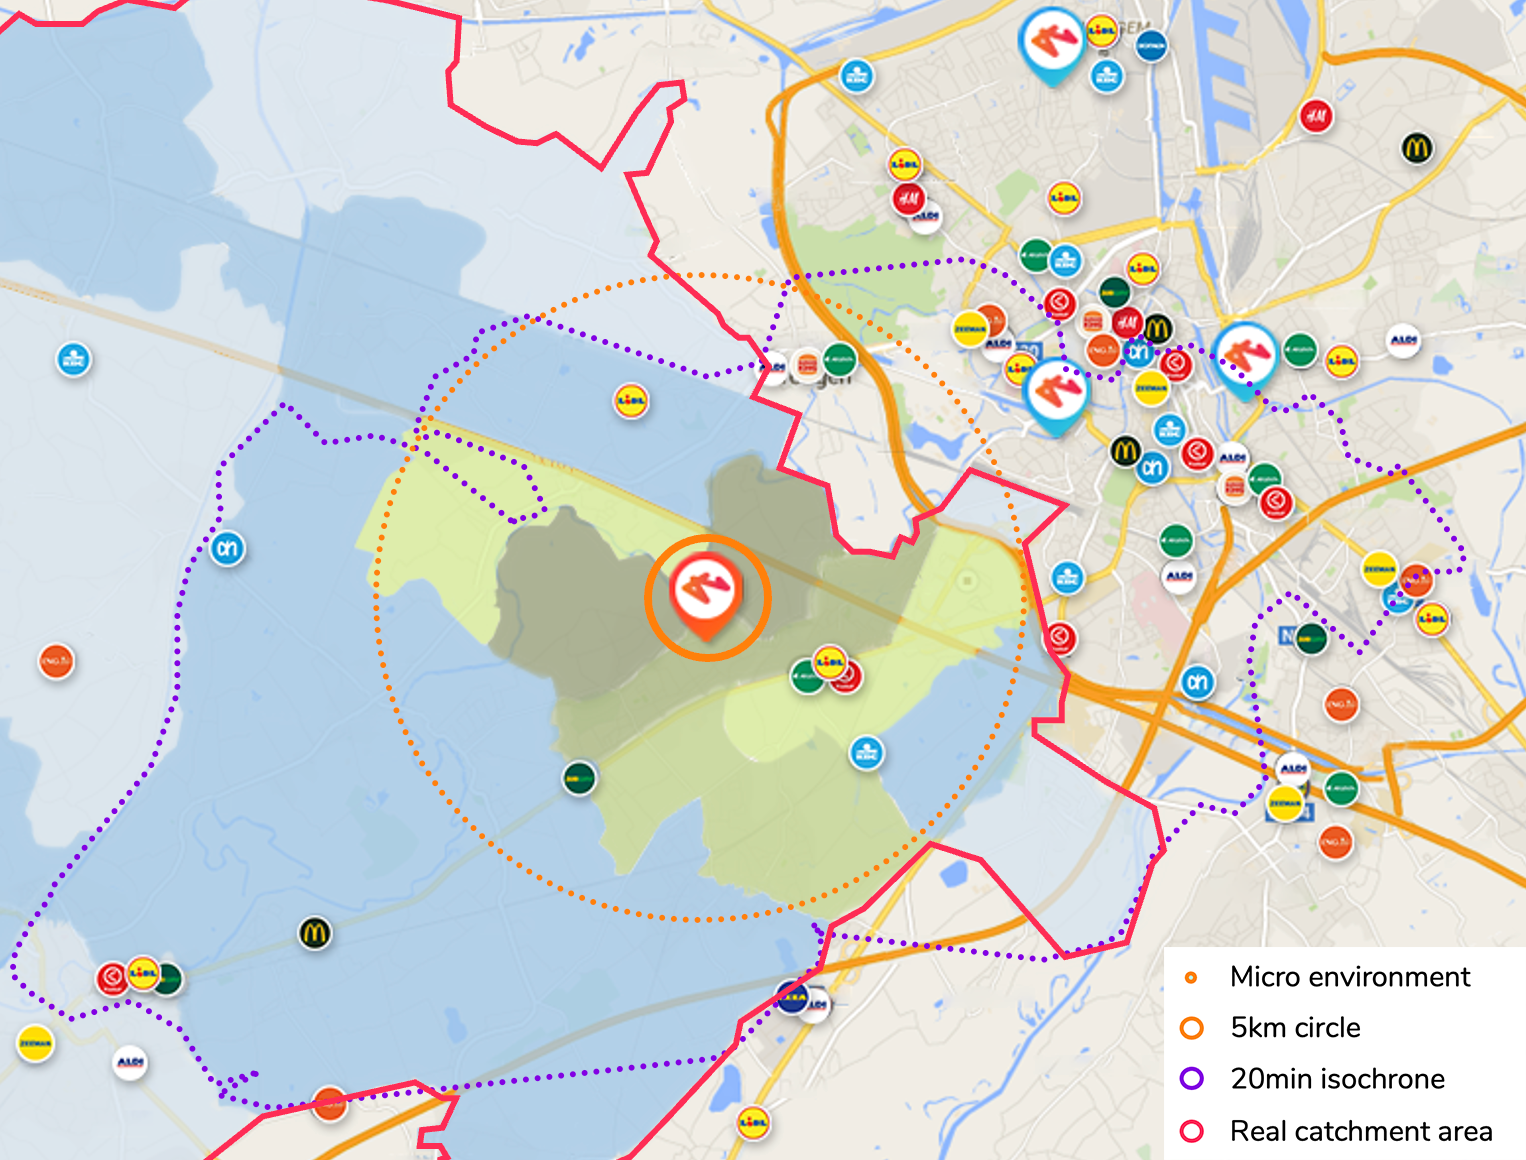
In areas near a store, there are often more customers, who visit more often but buy less per visit (lower sales amount). Therefore, it is essential to define these sales KPIs and to create separate statistics for the primary catchment area and the more distant areas. A comparison of the statistics for the stores within a cluster will show precisely what the problems are for each underperformer.
RetailSonar is already helping more than 60 retailers in four different countries with designing optimal location strategies. We do this using a unique online geomarketing platform and smart artificial intelligence. Would you like to find out more? View our solutions here!
