Optimise the ROI of your next flyer campaign in 10 steps
Although we live in digital times, Belgian retailers still jointly spend several millions of euros a year on leaflet campaigns. Except they hardly focus on mapping their distribution zones based on data. Customer origin information offers chains the opportunity to optimise their marketing campaigns in a customer-centric fashion.
Planning a leaflet campaign is a complicated undertaking, it has to be said. Many retailers worry about the cost and the fact that the ROI is so uncertain. Which leaves plenty of margin for optimisation. The main thing is to map the costs and benefits for every neighbourhood. Proper tooling allows you to keep up to speed with reality.
At RetailSonar this type of optimisation is engrained in our DNA. We fully rely on the descriptive and predictive power of data for this. Based on our many years of experience, we developed the Campaign Targeter, a geomarketing application that marketing managers can use to correctly assess the coverage of leaflet campaigns, and optimise it where appropriate.
"We were able to save up to 14% on the cost of our leaflet campaign without any impact whatsoever on our sales figures. On the contrary even, some of our shops generated up to 2% more sales.”
Joeri De Waele, partner and co-owner Fun. Read the Fun case.
Are you curious how you can use the Campaign Targeter? Follow these 10 steps to develop your own optimal distribution plan in no time at all.
1. Collect your data
Before you can start to optimise new campaigns, it is vital that you have an overview of previous marketing campaigns. So gather all the available data, such as sales results for every distribution zone, distribution figures or the total sales compared with the number of customers. Once you have entered these data in the platform, they will be supplemented with powerful current data and be visualised on a map.
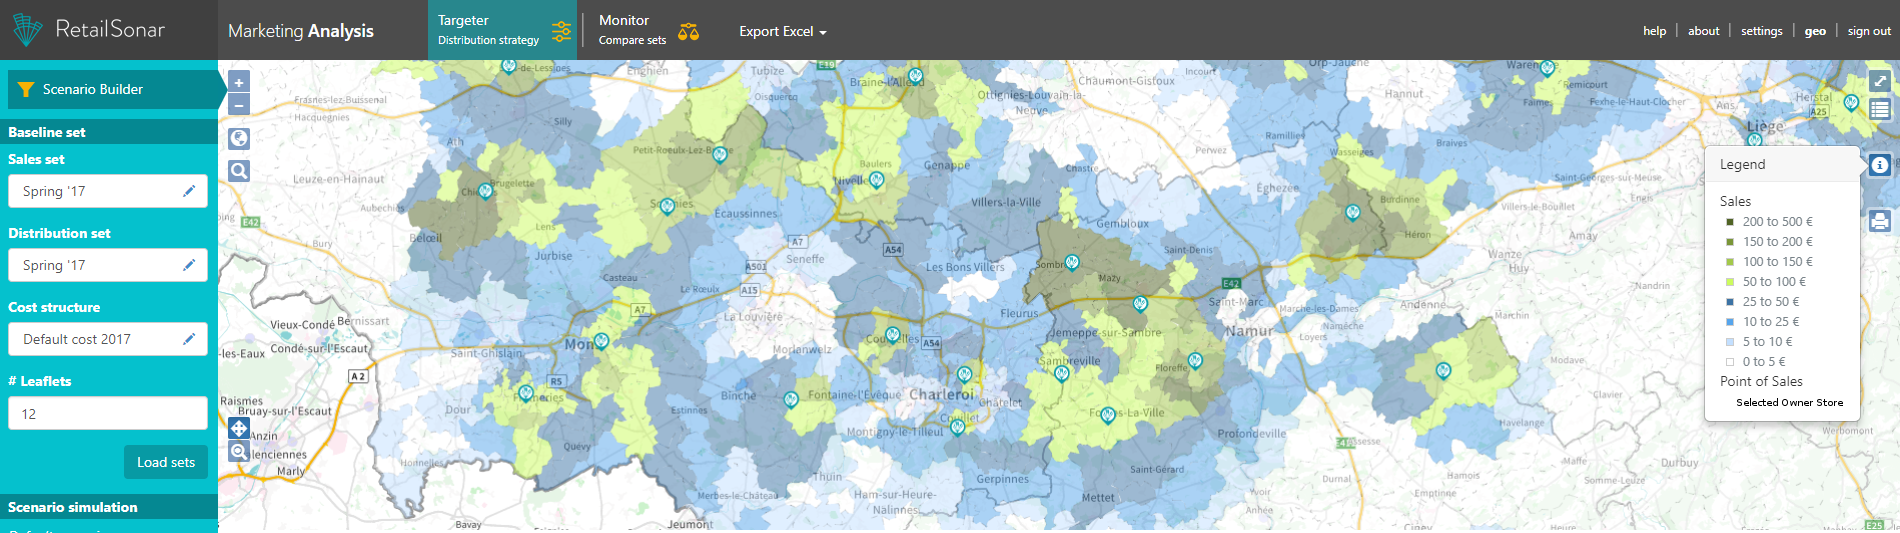
2. Determine the customer potential for each neighbourhood: “Where do my (future) customers live?”
Take a look at your current sales data to get an overview of where your customers are located. You will be able to identify potential new customers faster.
Are you still convinced that circles or isochrones are the best way of mapping your customer potential? Then think again! Because this reasoning focuses on your shops instead of on the customer. So think carefully about how you will determine the potential for every neighbourhood. Retailers who have customer origin information should start by mapping the current sales and visits for every shop and neighbourhood. The past is a valuable indicator for the future.
Obviously, you should make some corrections for shops you intend to open or close or shops whose forecast future sales are different compared with past results. Finally, it is worth noting that just determining the potential for every postal code often is not sufficient. Zooming in on the geographical level - to the neighbourhood level - means your mapping will be much more accurate.
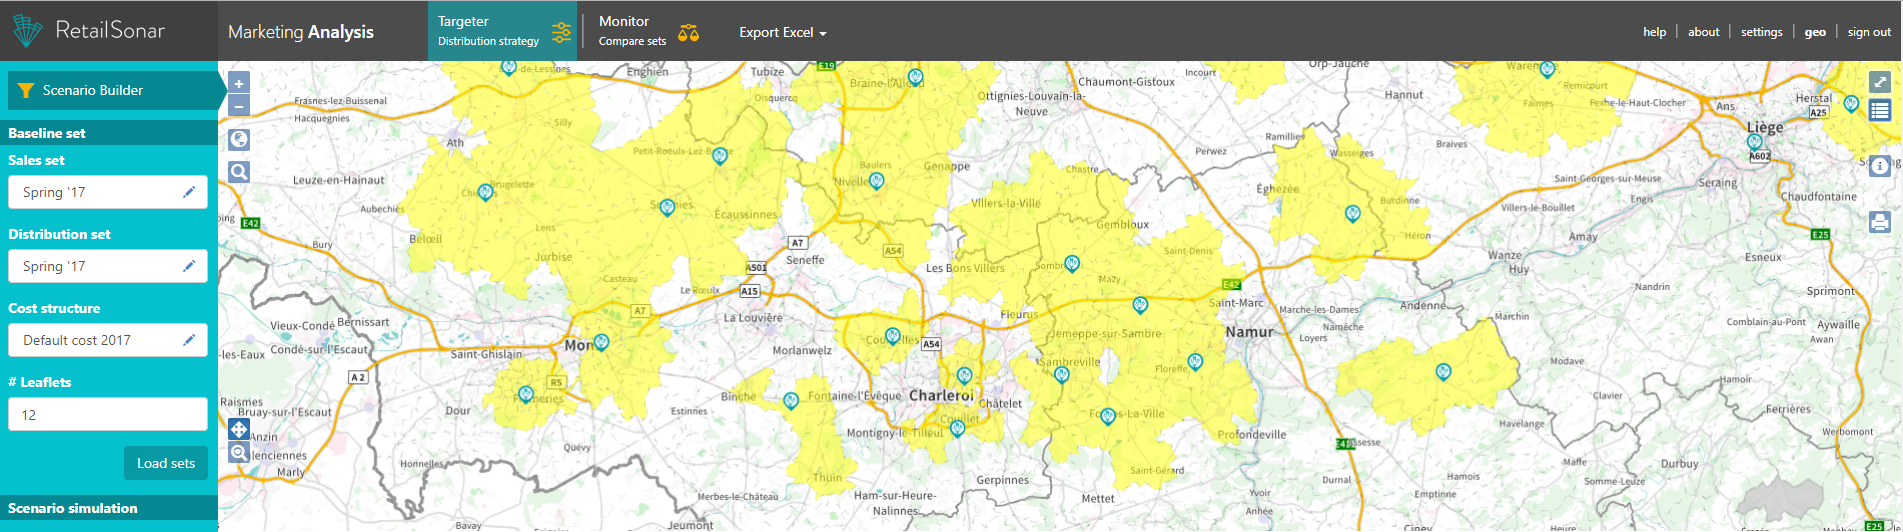
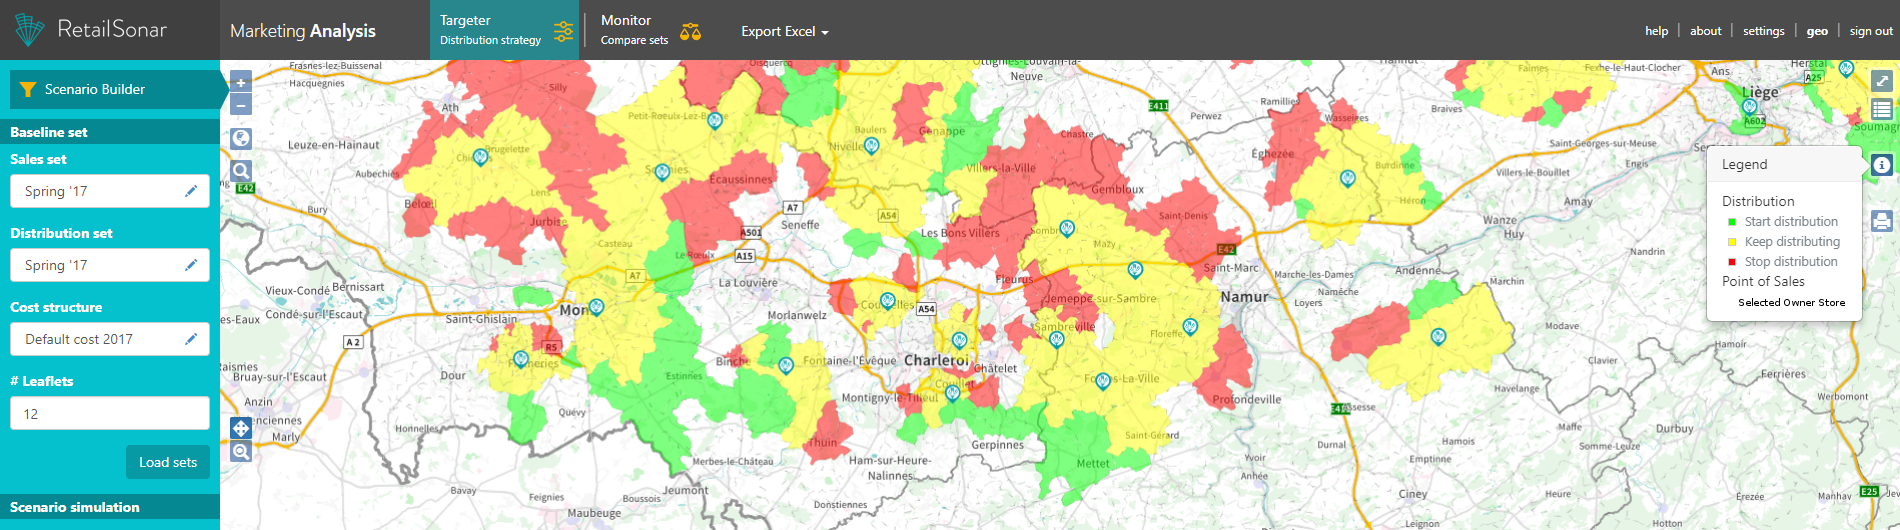
3. Visualise distribution data: “Where am I distributing my leaflets today and how many % of my customers do I reach with my flyers?”
Visualise your current distribution zones. The map will show you where you previously dropped leaflets. You should also factor in the number of mailboxes, the number of “no advertising” stickers and the percentage of campaign-related sales. The Campaign Targeter will then calculate the customer coverage of the current leaflet distribution, on the national level and for every shop.
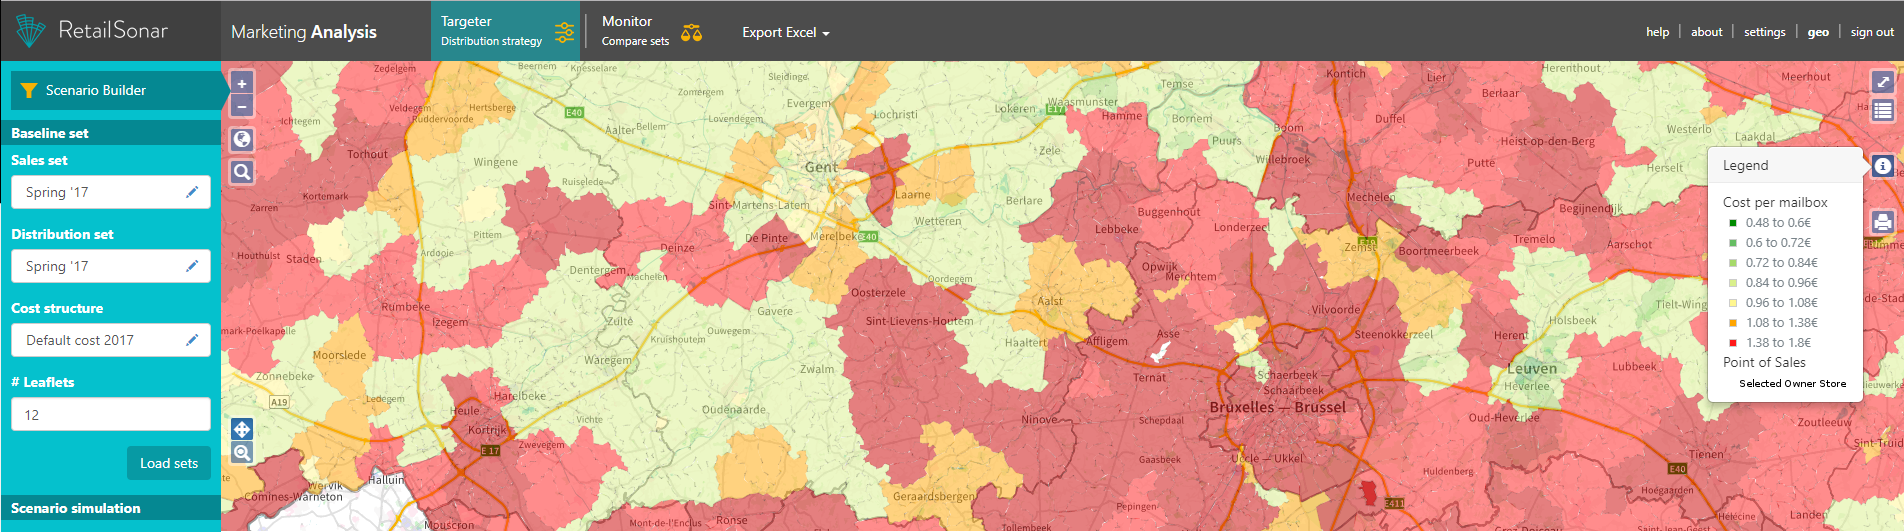
4. “How much does it cost me now?”
The cost is calculated for every zone. The total cost is the sum of the print cost, the distribution cost and the taxes. The tax cost is mainly determined by the tax for each zone, the format of the leaflet, the number of pages, the weight, and so on. We also know the percentage of “no advertising” stickers, allowing us to express the cost in net and gross mailboxes.
This gives you a clear overview of the overall cost, which is vital in a country like Belgium with its myriad of municipal taxes and where many people have a “no advertising” sticker on their mailbox.
5. Choose how you wish to optimise this: extend your coverage or pay less?
Every retailer is always interested in a maximum coverage of his customer potential at a minimal cost. So make sure you can weigh this for every neighbourhood!
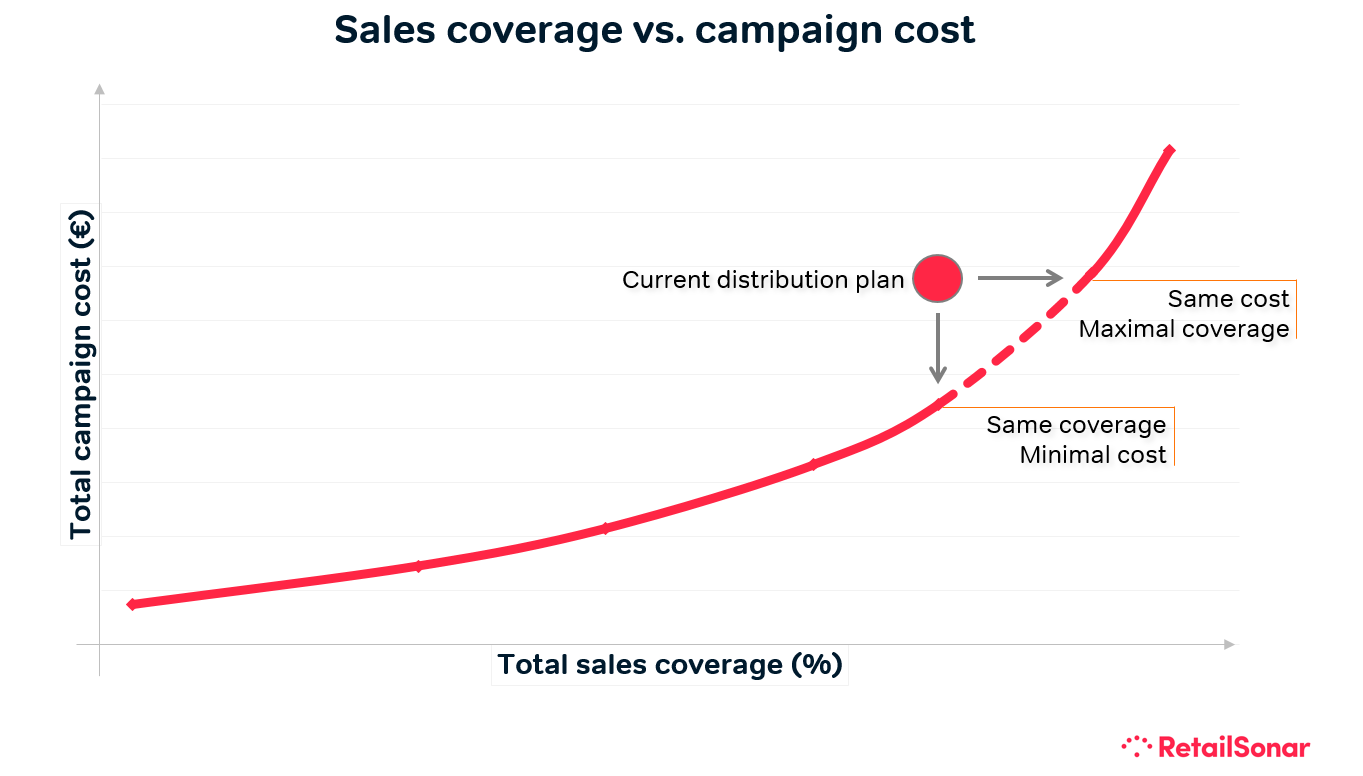
The Campaign Targeter will visualise the balance between customer potential and campaign cost by shop, neighbourhood and the overall balance. The colour code for the distribution zones indicates which zones have the highest potential ROI. If you choose the dark green zones, you will reach 30% of your customers. If you drop leaflets in all green zones, you will reach 80% of your customers. A red or orange zone will increase the cost of your campaign faster without significantly increasing your customer coverage. You can see this below where the relationship between the campaign cost and customer coverage is visualised for various optimum scenarios.
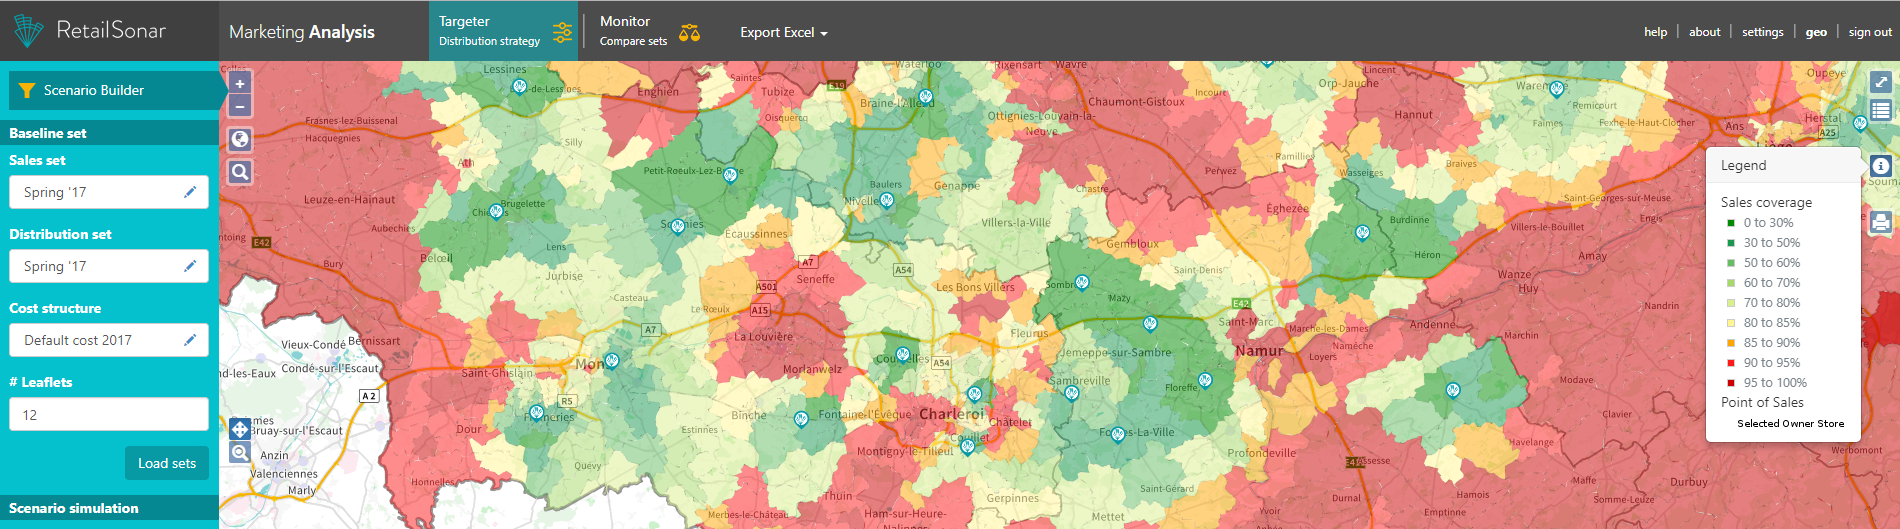
This means that sales and costs are always weighed against each other in an optimum distribution model, resulting in two optimisation scenarios. On the one hand, you can choose to reach just as many people at a lower cost. Or you can also strive for maximum sales coverage for the amount you are already paying (see chart).
6. Simulate a global optimal plan
As a retailer you must determine how much budget you have for your leaflet campaign. The Campaign Targeter will combine the data and the choices you made during the previous five stages to simulate the ideal distribution plan. It will also check for each zone whether you can continue, should start or stop distribution.
7. Dot your i’s
Obviously, those zones with sales figures that are too low or a cost that is too high will not be included in this optimum plan. As a result, the sales coverage of certain shops may become too low, which is why we added a facility that allows you to adapt your simulations yourself.
A lower sales coverage could be fatal for some shops. Our tool allows you to “save” these shops with location balancing, allowing you to tweak the optimum plan. Shops that just opened or branches that are already suffering will still benefit from the boost of a new marketing campaign as a result.
Does a zone only score well because of a few outliers or are some of the zones located in a language area that you prefer not to invest in? No problem, you can also “freeze” certain zones.
8. Determine how much every shop pays
“Who is going to pay for all this?” This is a very good question, especially if you work with a franchise model. The Campaign Targeter allows you to calculate fair share allocations. The distribution cost is allocated to the respective shops based on a correct allocation key - the sales generated per shop per neighbourhood. This avoids discussions among the branches, or (worse) situations whereby interesting neighbourhoods do not receive leaflets because none of the shops wants to pay for the distribution cost.
9. Send the final plan to the distributor
Once all the adjustments have been made, you can export your optimal distribution plan to an Excel file and send it to the distributor.
10. Measure the impact of your new distribution plan
Once you have implemented your new distribution plan, it might be interesting to measure the impact after a few weeks or months. The Campaign Targeter allows you to enter the sales results per neighbourhood for every campaign so you can easily see whether the new distribution plan is hitting the mark and gain some unique insights about the impact of your leaflet.
If you want to continue optimising, then repeat this ten-step plan frequently, supplementing it with new sales results.
The benefits of the Campaign Targeter at a glance
- Optimise leaflet distribution campaigns. Pay less for your distribution or reach more customers with the same budget. Maximise the ROI of your marketing campaigns.
- Integrate the most recent customer origin data in no time at all.
- Avoid expensive calculation errors with our extremely reliable costing model. Allocate the cost to your points of sale.
- Save time with the super-fast simulations. Tweak them yourself, if necessary.
- Visualise your marketing efforts. This is always useful for reporting to colleagues or externals.
- Keep your distribution plan up-to-date. Retailers with a dynamic network in which shops continuously open and close no longer can afford to analyse data just once a year. So enter your results in our platform after every campaign and adapt your strategy accordingly.